What is it about?
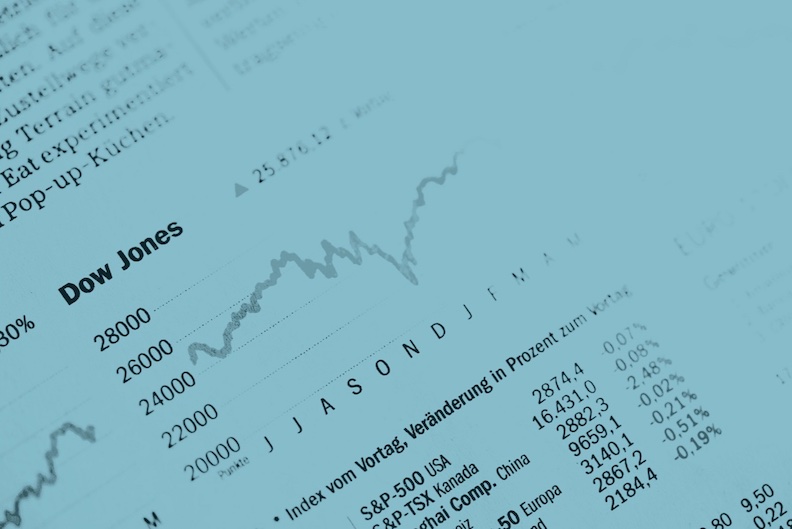
Stock market analysis, also known as Technical Analysis, is the process of deriving patterns from price movement. Technical analysts, known as chartists, attempt to predict the market by tracing patterns that come from the study of charts which describe historic data of the market. This study examines the effectiveness of Technical Analysis on US stocks for long range and shorter term.
Featured Image
Why is it important?
Forecasting is a difficult area of management. In the proposed research the author deals with a macro forecasting. The development and assessment of econometric methods for use in empirical finance and macroeconomics, with special emphasis on problems of prediction, is very important. This study examines the effectiveness of Technical Analysis on US stocks for long range and shorter term.
Perspectives
The rapid advance of internet and stock trading technology during the late 90's has bred a new kind of investor – one who is more independent and hands-on than ever before. Technical analysis has risen in popularity in recent years because it provides independent investors with the tools to make informed investing decisions. There are over 10 overlay indicators, and close to 40 Technical indicators. So that, Technical analysis helps independent online investors obtain and use financial information more effectively.
Dr. Galia Novakova Nedeltcheva
Politecnico di Milano
Read the Original
This page is a summary of: Forecasting Stock Market Trends, Economic Quality Control, January 2015, De Gruyter,
DOI: 10.1515/eqc-2015-6003.
You can read the full text:
Contributors
The following have contributed to this page