What is it about?
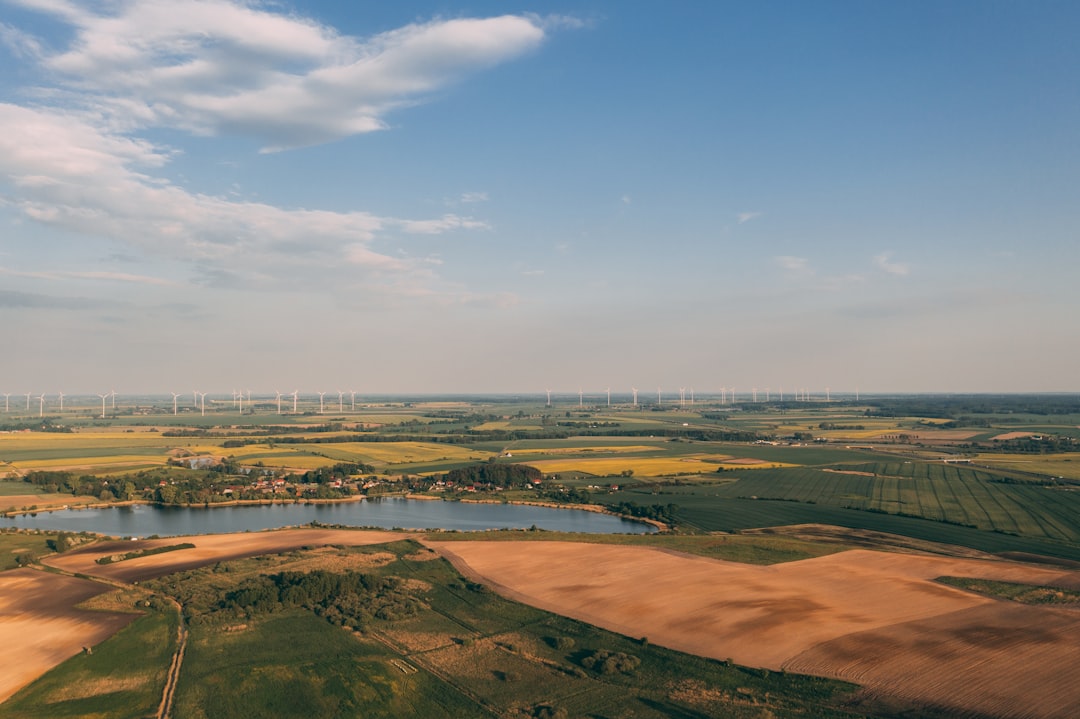
A large number of glaciers and ice caps (GICs) are distributed along the Greenland coast, physically separated from the ice sheet. The total area of these GICs accounts for 5% of Greenland’s ice cover. Melt water input from the GICs to the ocean substantially contributed to sea-level rise over the last century. Here, we report surface elevation changes of six ice caps near Qaanaaq in northwestern Greenland based on photogrammetric analysis of stereo pair satellite images. We processed the images with a digital map plotting instrument to generate digital elevation models (DEMs) in 2006 and 2010 with a grid resolution of 500 m. Generated DEMs were compared to measure surface elevation changes between 2006 and 2010. Over the study area of the six ice caps, covering 1215 km2, the mean rate of elevation change was -1.1 ± 0.1 m/a. This rate is significantly greater than that previously reported for the 2003-2008 period (-0.6 ± 0.1 m/a) for GICs all of northwestern Greenland. This increased mass loss is consistent with the rise in summer temperatures in this region at a rate of 0.12 degC/a for the 1997-2013 period.
Featured Image
Read the Original
This page is a summary of: Surface elevation change on ice caps in the Qaanaaq region, northwestern Greenland, Polar Science, September 2016, Elsevier,
DOI: 10.1016/j.polar.2016.05.002.
You can read the full text:
Contributors
Be the first to contribute to this page


