What is it about?
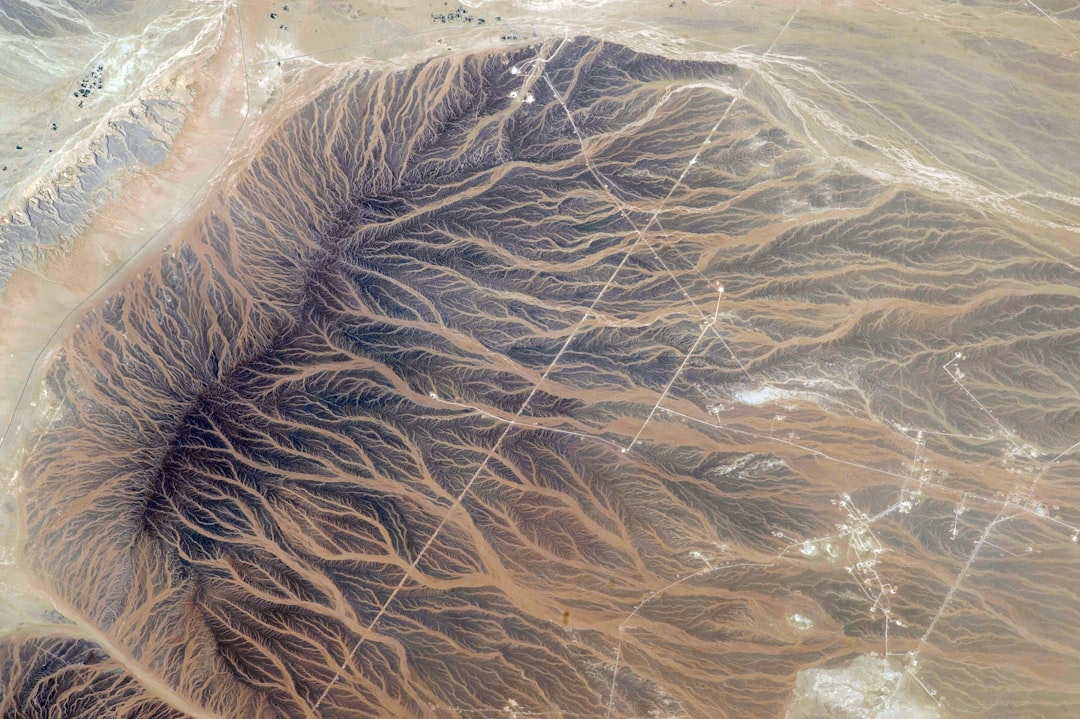
Active layer thickness (ALT) is critical to the understanding of the surface energy balance, hydrological cycles, plant growth, and cold region engineering projects in permafrost regions. The temperature at the bottom of the active layer, a boundary layer between the equilibrium thermal state (in permafrost below) and transient thermal state (in the atmosphere and surface canopies above), is an important parameter to reflect the existence and thermal stability of permafrost. In this study, the Geophysical Institute Permafrost Model (GIPL) was used to model the spatial distribution of and changes in ALT and soil temperature in the Source Area of the Yellow River (SAYR), where continuous, discontinuous, and sporadic permafrost coexists with seasonally frozen ground. Monthly air temperatures downscaled from the CRU TS3.0 datasets, monthly snow depth derived from the passive microwave remote-sensing data SMMR and SSM/I, and vegetation patterns and soil properties at scale of 1:1000000 were used as input data after modified with GIS techniques. The model validation was carried out carefully with in-situ ALT in the SAYR interpolated from the field-measured soil temperature data. The results of the model indicate that the average ALT in the SAYR has significantly increased from 1.8 m in 1980 to 2.4 m in 2006 at an average rate of 2.2 cm yr–1. The mean annual temperature at the bottom of the active layer, or temperature at the top of permafrost (TTOP) rose substantially from –1.1°C in 1980 to –0.6°C in 2006 at an average rate of 0.018°C yr–1. The increasing rate of the ALT and TTOP has accelerated since 2000. Regional warming and degradation of permafrost has also occurred, and the changes in the areal extent of regions with a sub-zero TTOP shrank from 2.4×10⁴ to 2.2×10⁴ km2 at an average rate of 74 km2 yr–1. Changes of ALT and temperature have adversely affected the environmental stability in the SAYR.
Featured Image
Why is it important?
There is not many in situ observations of permafrost in the source area of the Yellow River. The use of permafrost model therefore is important for studying the dynamics of active layer and permafrost.
Perspectives
The mean annual temperature at the bottom of the active layer, or temperature at the top of permafrost (TTOP) rose substantially from –1.1°C in 1980 to –0.6°C in 2006 at an average rate of 0.018°C yr–1. The increasing rate of the ALT and TTOP has accelerated since 2000. Regional warming and degradation of permafrost has also occurred, and the changes in the areal extent of regions with a sub-zero TTOP shrank from 2.4×10⁴ to 2.2×10⁴ km2 at an average rate of 74 km2 yr–1. Changes of ALT and temperature have adversely affected the environmental stability in the SAYR.
Dr Dongliang Luo
Northwest Institute of Eco-Environment and Resources, Chinese Academy of Sciences
Read the Original
This page is a summary of: Distribution and changes of active layer thickness (ALT) and soil temperature (TTOP) in the source area of the Yellow River using the GIPL model, Science in China Series D Earth Sciences, May 2014, Springer Science + Business Media,
DOI: 10.1007/s11430-014-4852-1.
You can read the full text:
Contributors
The following have contributed to this page