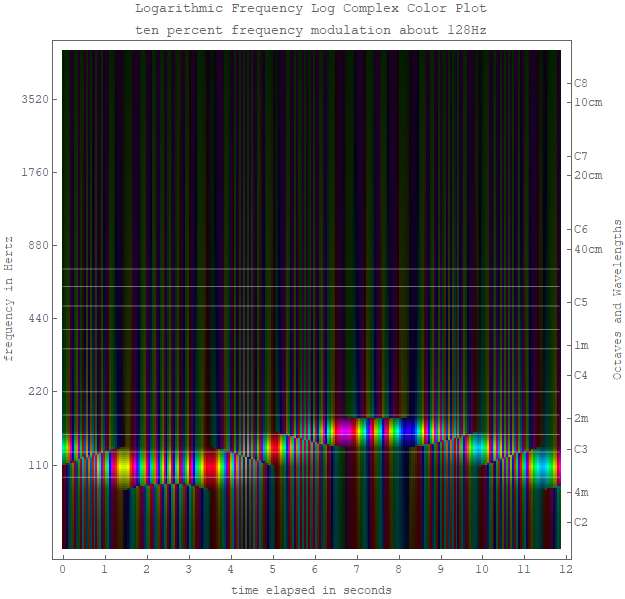
Project

Visual field guides to total sound

P. Fraundorf

What is it about?

Detective work on defects in the spatial harmonics of crystals has pointed us toward a way to convert any sound into real time color sheet music that contains quantitative visual information on note duration, intensity, attack, harmonics, warble, chirp, and even on oscillation phases that many of the best trained ears can't detect. Is that cool or what?

Why is it important?

Would visual field guides to sound be useful e.g. with bird call or instrument sound snippets on Wikipedia, particularly if an app for seeing sounds in real time was available on everyone's phone? Are there classes that this capability might come in handy for? Would you like to see a prototype put together for use in classes e.g. during Arianna String Quartet workshops for our How things work class. On the other hand, are you up for helping develop an app for browsers, iphone, android, or windows media player?

Perspectives

Visual field guides to total sound, developed here with help from Stephen Wedekind and Wayne Garver, open the door to real-time views of Fourier phase relationships as well as the aspects of sound that listeners with intact hearing can sense. This therefore opens the door to detective work on an aspect of sound heretofore ignored. The use of log complex color and log frequency (treble-bass clef) plots, further, make this information available to aurally impaired listeners in the realtime form long pioneered by musicians.

Resources3 total

Who is involved?