Data
Symptom Watch UK
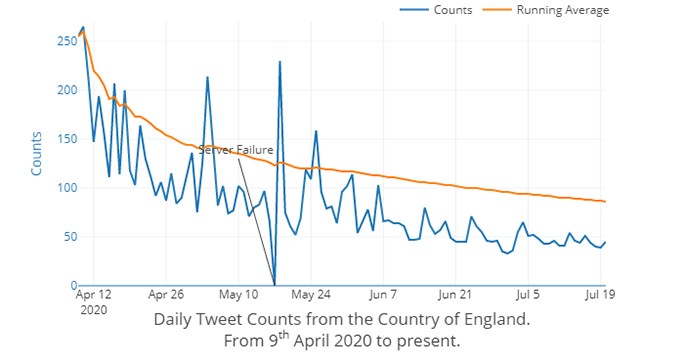
Daily Counts of UK Covid19 Symptom Tweets.
University of Liverpool EPSRC Impact Acceleration Account
Researchers at the University of Liverpool have developed a system to track and analyse tweets that mention symptoms of Covid-19. This system ‘listens’ for tweets that mention Covid-19 symptoms. Once identified, tweets are fed through a machine learning classifier which identifies whether it relates to a user’s personal symptoms, someone else’s symptoms or if the tweet contains misinformation.
The system also uses geolocation data to calculate the number of users who tweet about symptoms in each region of a given country (where geolocation is permitted by the user). From this data, it is possible to determine the number of users who travel between different regions of a given country. This information could potentially help to identify new outbreak clusters within a country and provide insight into how members of the public responded to lockdown measures.
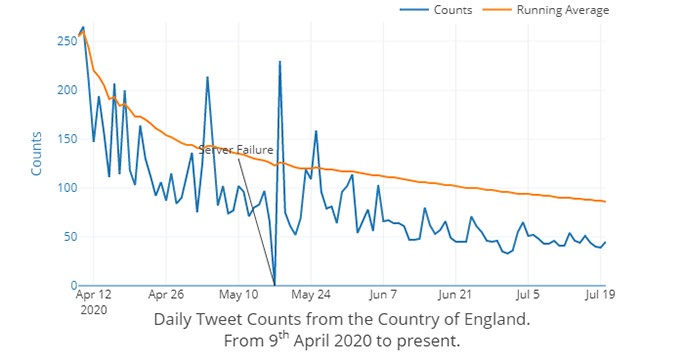
To make this information easily accessible, the team developed a ‘Symptom Watch’ dashboard, which reports a daily count of the number of tweets that mention symptoms. These counts are currently provided per state in the USA and at various levels (local and upper tier authority, NHS region and national) in the UK. This functionality will be extended to other countries in the near future.
The Liverpool research team have also been working with Evergreen Life to analyse data from their health and wellness app. In response to Covid-19, Evergreen Life have been asking app users questions to gain insight into the pandemic. Users are asked to report, for example, if they are isolating or if they or someone in their household has symptoms. The depth and breadth of the data collected is impressive and could answer an endless number of questions.
The team has developed solutions to answer to some of these questions — for example, “what is the average duration an individual experiences symptoms of Covid-19 for?” User reports to the Evergreen Life app are sporadic and therefore there isn’t a complete timeline of reports for the full duration an individual is exhibiting symptoms. To deal with the sporadic nature of user reports, the team defined and fit a Bayesian model in the ‘Stan’ programming language, which enabled the team to determine that users were most likely to experience symptoms for 3.06 days.
With social distancing measures in place, a large amount of discourse relating to Covid-19 now takes places on social media platforms such as Twitter. These platforms contain a treasure trove of information that can help us answer questions such as, “how many people are exhibiting Coronavirus symptoms today?” However, not all information is created equal — these platforms also contain a lot of misinformation which could potentially cause harm to members of the public.
This ongoing research demonstrates how novel data streams can be utilised to gain a deeper understanding of the Covid-19 pandemic. When combined with more conventional data streams, these novel data streams could aid governments in making more informed decisions to combat the virus.
As someone working at the crossroads of engineering, statistics, and computer science, I am naturally drawn to data-led approaches to inform difficult real-world decisions. I firmly believe that we can, and should, extract the information we need to benefit society from the big and small data that the world generates.
At the University of Liverpool, we are pioneering the research, development, and application of next-generation data science and AI technologies to use extracted information to solve pressing challenges such as the Covid-19 pandemic.
Daily Counts of UK Covid19 Symptom Tweets.
Our users are helping us understand how COVID-19 affects our health & wellbeing, as well as map where users have symptoms.