A decades-old method called geostatistics, used in the natural resources extraction industry to identify deposits, could be used to localize radiation exposure after a nuclear accident or to help understand emerging hot spots in the COVID-19 pandemic.
The method uses a small number of data points in order to reconstruct a complex situation or environment. We showed a recent publication that geostatistical analysis could be accurately used to pinpoint the location of a radiation plume in the event of a nuclear accident.
We derive a radiation plume from a very limited number of samples. While this paper isn’t about COVID-19, the methods we describe could be used for late stage epidemiology in the current pandemic. It could fill a gap in assessment after community transmission, when patient tracking is no longer an effective mitigation strategy to identify sources of infection transmission.
Why is it important?
We believe that this approach could be useful for monitoring COVID19 for potential resurgence of viral transmission after most individuals have recovered and thought to be non-infectious. In such instances, we expect that new infections will emerge in a neighborhood or region where the virus is otherwise under control. It may not be possible to trace the origins of the infections to specific sources, but geostatistical analysis may point to the likely locations that may be the source of these hotspots. Consider the example of a particular subway station in NYC which harbors a hidden reservoir of virus. Individuals who present with SARS-CoV-2 may live in different neighborhoods surrounding the station and present at different hospitals or community clinics. It may not be obvious to epidemiologists that they all passed through the same station. However, if we had a geostatistically-derived map based on positive or likely positive SARS-CoV-2 testing results in that neighborhood that is updated over time, it could be used to monitor for locations of hot spots where viral transmission has occurred. In theory, at least, the location of the subway station could be inferred from the locations of newly diagnosed individuals in the adjacent neighborhoods. Depending on the granularity of the sampling and the rate of transmission of the virus (presumably these individuals are no longer under quarantine), densification should be able to pinpoint the station for cleanup (or closure).
Perspectives
Backstory:
There is an interesting connection between radiobiology and cytogenetics. The IAEA and ISO-approved test for radiation exposure is the dicentric chromosome (DC) assay (>50 years) . DCs are an intermediate in the formation of inverted duplicated chromosomes eg. 15's (10.1371/journal.pgen.100419). It takes a biodosimetry reference lab 2-3 hrs per sample to score the 500-1000 cells required (and a clinical lab wouldn't be much faster). Radiation exposure levels that cause acute radiation syndrome (eg. Chernobyl) couldn't be read out in time to treat the exposed individuals (with GM-CSF). Many years ago, I was doing some image segmentation analysis of DAPI stained chromosomes for scFISH probes. We were invited to the Can-US Biodosimetry meeting to discuss this work, and we were pressed into developing algorithms and software to automate the interpretation of these metaphase image data. We finally released the product about 2 years ago (https://adciwiki.cytognomix.com or radiation.cytognomix.com) and it has been validated by Health Canada and Canadian Nuclear Labs. It can analyze 500 metaphase cells and determine radiation dose in ~3 minutes on a gaming laptop. We obtained some funding to scale the software on an IBM supercomputer, which enabled 40,000 samples to be analyzed in 24 hr. Sample acquisition, preparation and metaphase image capture became the bottleneck in a large scale accident or nuclear event. Labs with sample prep automation of slide dropping, tissue culture, and several microscope scanning instruments can process about 1000 samples in 4-5 days. We developed the geostatistical approach described in the paper to reduce the workload for estimating exposures to a population within that envelope. It is an iterative process. The radiation map computed after each round is used to select locations in the next round of sampling, ie. with the highest variance between spatially colocated individuals. This quickly rebuilds the map that is derived with physical radiation detectors. Absorbed radiation is not the same as physical radiation levels.
We believe that the approach will be useful for other applications, for example localizing emerging hotspots of SARS-CoV-2 infections after community transmission, when contact tracing may not be effective.
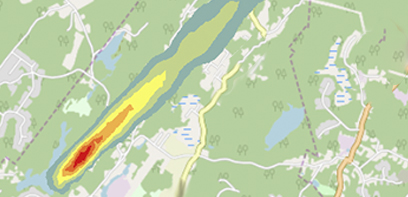
Our samples individuals in a population that have received clinically relevant doses of radiation exposure. It reconstructs the physical radiation plume generated by a moderate sized nuclear detonation in NYC using data from ~310 locations (or individuals). We use a process called kriging to reconstruct the radiation plume with topographic contours at different radiation levels from sampling locations. The process was completed in 3 steps, with each iteration of the plume pointing towards the locations to be sampled in the subsequent steps in order to improve its accuracy. The selection of those locations is based on variance between adjacent sampling locations in the previous plume. That is, the algorithm chooses these locations for the next survey in order to increase the confidence in measurements in this part of the plume.
Using geostatistics to track COVID-19 transmission hot spots
“We believe this could be useful for monitoring COVID-19 for potential resurgence of viral transmission after most individuals have recovered and thought to be non-infectious,” he said. “In such instances, we expect that new infections will emerge in a neighborhood or region where the virus is otherwise under control. It may not be possible to trace the origins of the infections to specific sources, but geostatistical analysis may point to the likely locations that may be the source of these hotspots.”
Rogan uses the example of a New York City subway station as a transmission source of COVID-19. Individuals who present with the virus may live in different neighborhoods surrounding the station and present at different hospitals or community clinics.
“It may not be obvious to epidemiologists that they all passed through the same station. However, if we had a geostatistically-derived map based on likely positive, or positive test results for COVID-19 for that neighborhood that is updated over time, it could be used to monitor for locations of hot spots where viral transmission has occurred.”
Rogan says in theory the location of the subway station could be inferred from the locations of newly diagnosed individuals in the adjacent neighborhoods.
Press briefing
Researchers explore the possibility of using geostatistics to track radiation exposure
The method uses a small number of data points in order to reconstruct a complex situation or environment. Peter Rogan, PhD, Canada Research Chair in Genome Bioinformatics and Professor in the Departments of Biochemistry and Oncology, demonstrated in a recent publication that geostatistical analysis could be accurately used to pinpoint the location of a radiation plume in the event of a nuclear accident.
“The paper uses geostatistics to derive a radiation plume from a very limited number of samples,” Rogan said.
The idea is to estimate the amount of exposure at locations that have not been tested using results from locations or individuals close by. Initially, the researchers randomly test individuals or locations and create a rough map of exposures. They then choose locations for a subsequent round of sampling by first responders based on the level of confidence in these estimates in the previous round. After several rounds of sampling, the radiation map is no longer improved by adding more samples.
This story was originally published at the University of Western Ontario, Schulich School of Medicine Blog site: https://www.schulich.uwo.ca/about/news/2020/april/feature_researchers_explore_the_possibility_of_using_geostatistics_to_track_covid19_transmission_hot_spots.html
Background Accurate radiation dose estimates are critical for determining eligibility for therapies by timely triaging of exposed individuals after large-scale
Background: Accurate radiation dose estimates are critical for determining eligibility for therapies by timely triaging of exposed individuals after large-scale
Peter Rogan, PhD, demonstrated that geostatistical analysis could be accurately used to pinpoint the location of a radiation plume in the event of a nuclear acc
Accurate radiation dose estimates are critical for determining eligibility for therapies by timely triaging of exposed individuals after large-scale radiation e
This is the data repository for the PLOS ONE Manuscript: "Meeting radiation dosimetry capacity requirements of population-scale exposures by geostatistical samp